Understanding the factors that affect your website’s performance and how to monitor them is crucial for providing a seamless user experience. Here’s a breakdown of what happens during a typical request to your WordPress site and how you can improve and monitor performance.
What Does a Typical WordPress Request Look Like?
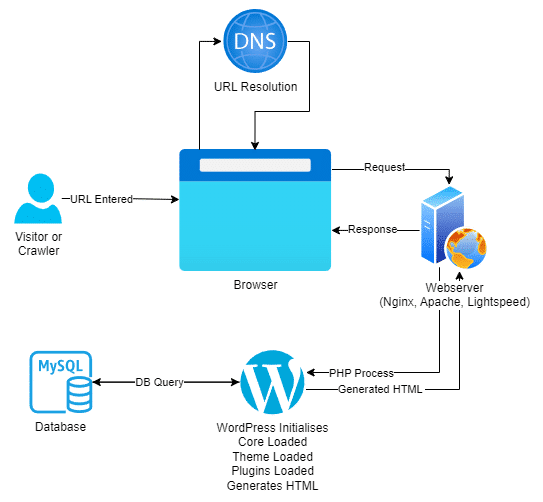
- User Request – The visitor enters a URL in their browser and presses Enter.
- DNS Resolution – The browser sends a request to a DNS server to resolve the domain name into an IP address.
- Browser Sends HTTP Request – Once the IP address is resolved, the browser sends an HTTP request to the server hosting the WordPress website
- Web Server Receives Request – The web server (e.g., Apache, Nginx) receives the HTTP request
- WordPress Initialization –
- The web server hands over the request to the PHP interpreter.
- WordPress core files are loaded.
- WordPress initializes, loading themes, plugins, and setting up the environment
- Database Query – WordPress sends a query to the MySQL database to retrieve the content related to the requested URL. The database returns the required data (e.g., posts, pages)
- Generate HTML – WordPress processes the data and PHP templates to generate the final HTML.
- Send Response – The generated HTML is sent back to the web server. The web server sends the HTML response back to the user’s browser
- Browser Renders HTML – The browser receives the HTML. The browser parses the HTML, loads any associated CSS, JavaScript, and images, and renders the page for the user.
What Affects Performance?
As can be seen above from the typical WordPress request, there are many areas in which performance can be impacted these include but are not limited to:
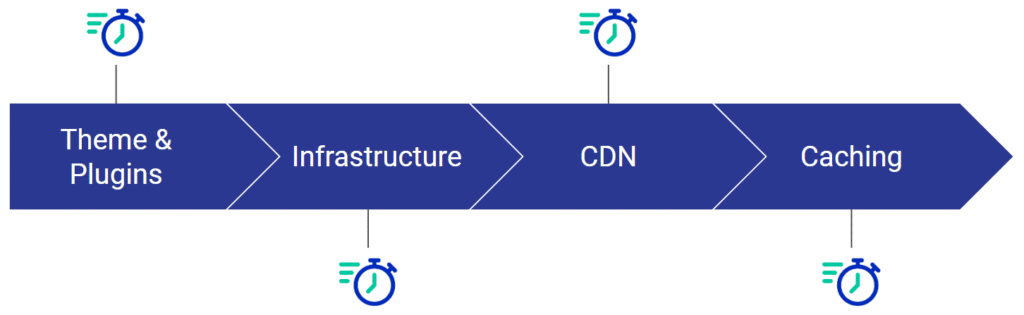
- Themes & Plugins – The quality and number of themes and plugins can significantly affect load times.
- Infrastructure – The server’s hardware and network capabilities play a crucial role.
- CDN – A Content Delivery Network can help distribute content more efficiently
- Caching – Proper caching mechanisms can reduce load times by storing copies of your site’s pages
- Browser Caching – Stores static files (like images, CSS, and JavaScript) on the user’s local device, reducing the need to download these files on subsequent visits.
- Page Caching – Saves the fully rendered HTML of a page, allowing the server to serve the cached version quickly without processing PHP scripts and database queries.
- Opcache – Caches the compiled bytecode of PHP scripts, reducing the overhead of parsing and compiling PHP code on each request
- Redis Caching – Uses the Redis in-memory data structure store to cache database queries and other frequently accessed data, significantly speeding up data retrieval times.
How to Monitor Performance?
Effectively monitoring your website’s performance is crucial for promptly identifying and resolving potential issues. Here are some powerful tools you can utilize to ensure optimal performance.
Google Lighthouse – An open-source, automated tool for improving the quality of web pages. You can run it against any web page, public or requiring authentication. It has audits for performance, accessibility, progressive web apps, SEO, and more


GTmetrix – Another powerful tool for analyzing your website’s performance, providing insights and recommendations for improvement

![]()
Grafana – A robust open-source platform for analytics and interactive visualization. Grafana enables us to create detailed charts, graphs, and alerts by connecting to various supported data sources, offering comprehensive insights and recommendations for improving your software’s performance.


Where to from here?
Ensuring optimal performance for your WordPress site is crucial for delivering a seamless user experience and maintaining high search engine rankings. By understanding the request lifecycle, identifying the factors that impact performance, and utilizing powerful monitoring tools like Google Lighthouse, GTmetrix, and Grafana, you can proactively address potential issues and continuously improve your site’s efficiency.